




How Should Buyers Compare Energy Use Across Roof Tile Machines?
A roof tile machine with a lower motor rating does not necessarily cost less to run. Buyers should compare electricity consumed per saleable tile.
A meaningful roof tile making machine energy consumption comparison starts with equivalent products, production conditions, and measurement boundaries. Installed power alone cannot establish operating efficiency.
Output rate, reject levels, idle time, and auxiliary equipment can change the result. Supplier figures become useful when buyers understand exactly what each measurement includes.
This guide explains how to request comparable test data, calculate energy costs, and assess efficiency alongside capacity, quality, maintenance requirements, and purchase price before investing.
Which Energy Figure Actually Helps You Choose?
The most useful starting metric is kilowatt-hours per saleable tile. It connects electricity consumption with usable production, making it more informative than a motor rating.
Calculate this figure by dividing measured electricity consumption by the number of tiles meeting your agreed quality requirements within the corresponding production batch or period.
Specific electricity consumption = measured electricity in kWh ÷ saleable tiles produced. Always identify the equipment included and the conditions under which production was measured.
Installed power, expressed in kilowatts, describes equipment ratings. Energy, expressed in kilowatt-hours, measures consumption over time. Confusing these quantities can produce misleading comparisons between machines.
A larger machine may use more electricity each hour while consuming less per acceptable tile. That advantage matters only if your business needs its output.
Use several indicators together: kWh per saleable tile, saleable tiles per hour, reject percentage, and annual operating cost. Each reveals a different purchasing consideration clearly.
Make Sure Both Machines Are Producing the Same Product
Before comparing figures, define the tile specification. Dimensions, thickness, weight, profile, strength requirements, and surface finish can affect processing demands and the number of acceptable tiles.
For concrete roof tiles, agree on the mix design, moisture conditions, material preparation, and acceptance criteria. Different recipes can change machine behavior and product quality.
Compare equivalent manufacturing routes. Concrete forming equipment, clay extrusion systems, and metal roll-forming machines involve different processes, so their energy figures are not directly interchangeable.
When tile sizes differ, consider a supplementary measure such as kWh per square meter of finished roof coverage, using each product’s specified effective coverage area.
This coverage measure helps commercial comparisons, but it does not remove differences in performance or processing. Keep product specifications beside the energy results for context.
Define saleable quality before testing. Depending on the product, relevant checks may include dimensional tolerances, appearance, strength, and defects identified after curing or other finishing.
What Equipment Must Be Included in the Comparison?
A forming machine’s electricity figure may exclude equipment necessary to make finished tiles. Buyers should establish a measurement boundary before requesting quotations or interpreting demonstrations.
For concrete tile production, that boundary may include batching, mixing, conveying, forming, hydraulic systems, compressed air, handling equipment, and electrically powered curing or finishing operations.
Some facilities also use fuel or purchased heat. Record these separately by energy source, then include their costs when comparing total production expenses across options.
A supplier’s machine-only measurement can still be useful for evaluating the forming stage. Label it clearly and request additional figures for the proposed production line.
Shared utilities require particular care. If a compressor serves several lines, document how its electricity is allocated instead of assigning an unsupported estimate to one machine.
Use the same boundary for every quotation. The table below shows what buyers should clarify before accepting an energy figure as a purchasing basis.
Request a Test That Reflects Your Production Schedule
A brief demonstration at maximum speed may show favorable efficiency while overlooking startup losses, stoppages, and idle consumption. Request a representative production period instead.
The test should reflect your intended operating pattern: shift length, product changes, expected loading, and normal interruptions. Record departures from these assumptions in the report.
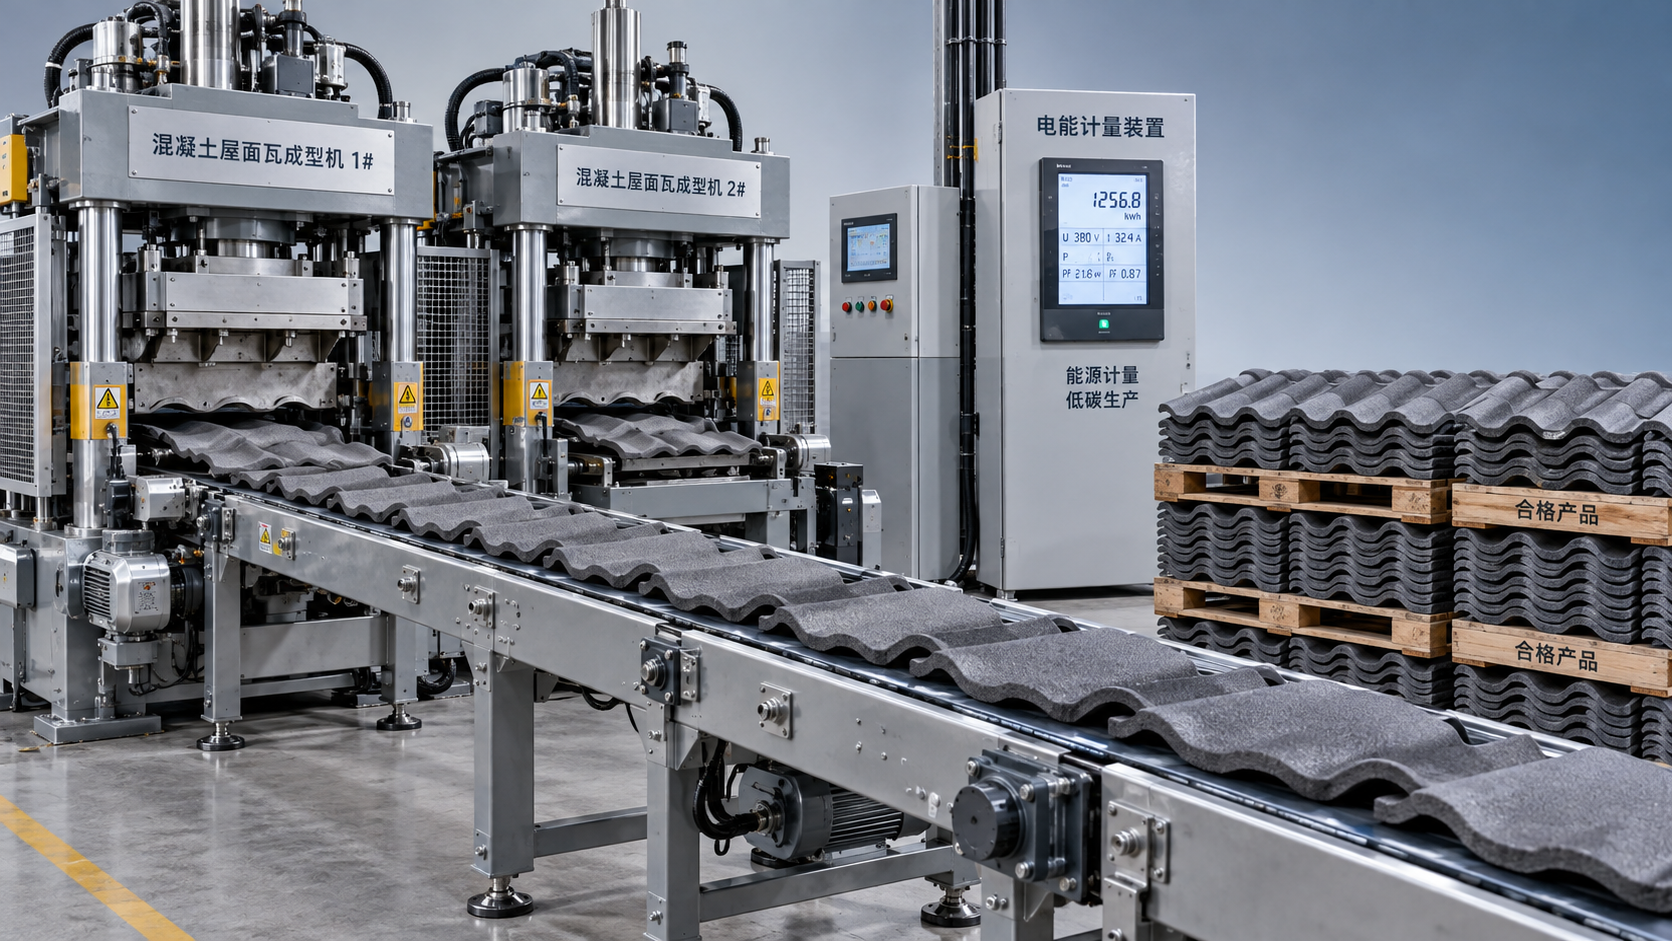
Use a suitable electricity meter at the agreed measurement boundary. Meter installation should follow site electrical procedures and be performed by appropriately qualified personnel safely.
Record energy over a defined period, alongside operating time, gross output, accepted output, and stoppages. Keep readings traceable to the specific machine configuration being evaluated.
Where final acceptance depends on curing or later inspection, track the tested batch through that stage. Early visual acceptance may understate the eventual reject rate.
Ask for repeated runs when practical. Consistent results across representative conditions provide stronger evidence than a single demonstration selected because it produced an attractive number.
How Do You Calculate and Interpret the Results?
Consider two hypothetical machines tested for six hours under equivalent conditions. The example below illustrates the calculation; it does not represent any manufacturer’s verified performance.
Machine A consumes more electricity during the test but uses less per saleable tile. Its higher output spreads the measured energy consumption across more products.
At equal annual production of two million saleable tiles, the difference is 6,000 kWh. At $0.15 per kWh, that represents $900 in annual electricity savings.
These results assume the measured efficiency remains representative. Lower demand, additional product changes, different rejection rates, or changed utility conditions could alter the annual outcome.
Also check whether each machine can meet required production within available shifts. A favorable energy figure cannot compensate for insufficient capacity during your busiest periods.
Check Efficiency at the Output You Actually Need
Maximum-speed efficiency does not necessarily predict performance at your planned workload. A line that frequently waits for orders may consume substantial energy while producing nothing.
Request consumption data at expected operating levels, including reduced throughput where relevant. Ask how standby modes affect hydraulic pumps, conveyors, compressors, heaters, and other auxiliaries.
Separate productive running, idle operation, and startup energy in the test report. This breakdown helps you estimate consumption for your actual shift pattern more accurately.
Review the production bottleneck as well. Faster forming offers limited benefit if mixing, handling, or curing capacity prevents the line from sustaining the advertised output.
Choose capacity with a realistic allowance for growth and maintenance. Excess capacity can become expensive when equipment operates far below the conditions supporting its efficiency claim.
Which Design Features Deserve Closer Inspection?
Efficiency features deserve credit when their benefits appear in measured production results. A component list alone cannot establish how economically the complete system will operate.
Variable-speed drives can reduce consumption in suitable applications, particularly when demand varies. Ask which loads they control and whether the test reflects your expected duty cycle.
Hydraulic efficiency depends on system design, operating pressure, temperature, and control strategy. Ask how the system limits unnecessary running and maintains stable forming performance consistently.
Compressed-air leaks, excessive pressure settings, poor lubrication, and worn components can increase consumption. Discuss maintenance requirements and the practical effort needed to preserve demonstrated efficiency.
Automatic shutdown and standby functions may reduce idle losses. Confirm their restart behavior, operator requirements, and effects on production continuity during routine stops and interruptions.
Quality control also affects energy performance. Equipment that consistently produces acceptable tiles avoids spending electricity, materials, and labor on products that must later be rejected.
Will Energy Savings Justify a Higher Purchase Price?
Convert the measured consumption difference into annual savings using your forecast saleable output and electricity tariff. Use realistic production volumes rather than theoretical maximum capacity.
Annual electricity cost = kWh per saleable tile × annual saleable tiles × electricity price. Add separately estimated idle or startup consumption when necessary for accuracy.
Avoid double counting: if the specific consumption figure already includes representative startup and idle periods, those same costs should not be added again to annual estimates.
Using the earlier example, a $3,000 purchase premium would require approximately 3.3 years to recover through $900 annual electricity savings, before financing and other differences.
Compare maintenance, wear parts, labor, material losses, downtime, and support alongside electricity. These costs may outweigh a small difference in energy consumed per acceptable tile.
Where tariffs include demand charges, time-of-use rates, or power-factor penalties, assess those separately. A flat electricity price may not capture the full operating bill accurately.
What Should Buyers Ask Suppliers to Document?
A useful supplier report should make its claim reproducible. Request enough detail to understand the conditions, measurement method, equipment configuration, and basis for accepted output.
- Exact machine model, configuration, and included auxiliary equipment.
- Tile dimensions, weight, material recipe, and quality acceptance criteria.
- Test duration, operating schedule, stoppages, and startup treatment.
- Measured kWh, gross output, saleable output, and reject rate.
- Metering method, measurement boundary, and treatment of shared utilities.
- Conditions supporting any quoted energy-performance commitment.
Keep these requirements consistent across suppliers. A standardized request makes it easier to identify missing information and compare proposals without relying on promotional efficiency language.
For discussions with Shandong Hongfa Scientific Industrial & Trading Co., Ltd., request model-specific energy data and confirm the proposed roof tile production equipment and configuration.
Broad manufacturing experience, certifications, and an energy-conservation mission provide company context. Purchasing decisions still require relevant evidence of consumption, output, quality, and service support.
Choose the Lowest Practical Cost per Acceptable Tile
The strongest roof tile making machine energy consumption comparison uses matched products, consistent measurement boundaries, representative operating conditions, and output verified against agreed quality requirements.
Shortlist machines that meet production and quality needs first. Then compare measured energy performance, annual ownership costs, maintenance demands, and the reliability of supplier evidence.
Before ordering, document the agreed test procedure and any contractual performance commitments. This gives both parties a clear basis for evaluating results during equipment acceptance.
A sound purchase combines efficient production with dependable output and manageable operating costs. Choose the machine whose demonstrated performance fits your factory’s actual demand and conditions.