




What Is the Investment Cost per Cubic Meter for an AAC Line
Understanding the aerated concrete block production line investment cost per cubic meter is not a matter of dividing total project spending by nominal annual output. In AAC projects, that shortcut often produces a misleading number and, in some cases, a poor investment decision. A line that looks cheaper on paper may carry higher steam consumption, unstable density control, lower yield, or expensive maintenance. A more expensive line may actually deliver a lower real investment cost per cubic meter once utilization, product mix, and operating reliability are considered.
For investors, plant managers, procurement teams, and technical evaluators, the useful question is not “What is the standard AAC line cost?” but “What cost per cubic meter is realistic for my capacity, product positioning, and operating environment?”
The answer depends on how the line is configured, how much infrastructure is included in the budget, and whether the project is designed for theoretical output or bankable long-term production.
Why “investment cost per cubic meter” is often misunderstood
In AAC industry discussions, project budgets are sometimes compared using a very rough benchmark: total fixed investment divided by planned annual cubic meter output. This can be helpful as a first screening tool, but it hides several differences that materially affect project economics.
Two AAC plants may both claim the same annual capacity, yet have very different cost structures because of:
- different product sizes and density grades;
- different automation levels;
- local labor and energy conditions;
- whether the quote includes autoclaves only or a full plant package;
- differences in land development, utilities, and boiler systems;
- the expected operating rate in the first two years.
This is why comparing headline capital expenditure without checking scope is risky. In practice, the investment cost per cubic meter should be evaluated in at least three ways:
- Installed capital per designed annual capacity — useful for early benchmarking;
- Capital per actual saleable cubic meter — more realistic for financial planning;
- Lifecycle cost per cubic meter — the most relevant for strategic investors.
What is typically included in AAC line investment
When buyers request quotations for an AAC plant, suppliers may define “investment” differently. Some provide machinery prices only; others include process design, auxiliary systems, installation guidance, and commissioning support. A meaningful comparison starts with investment scope.
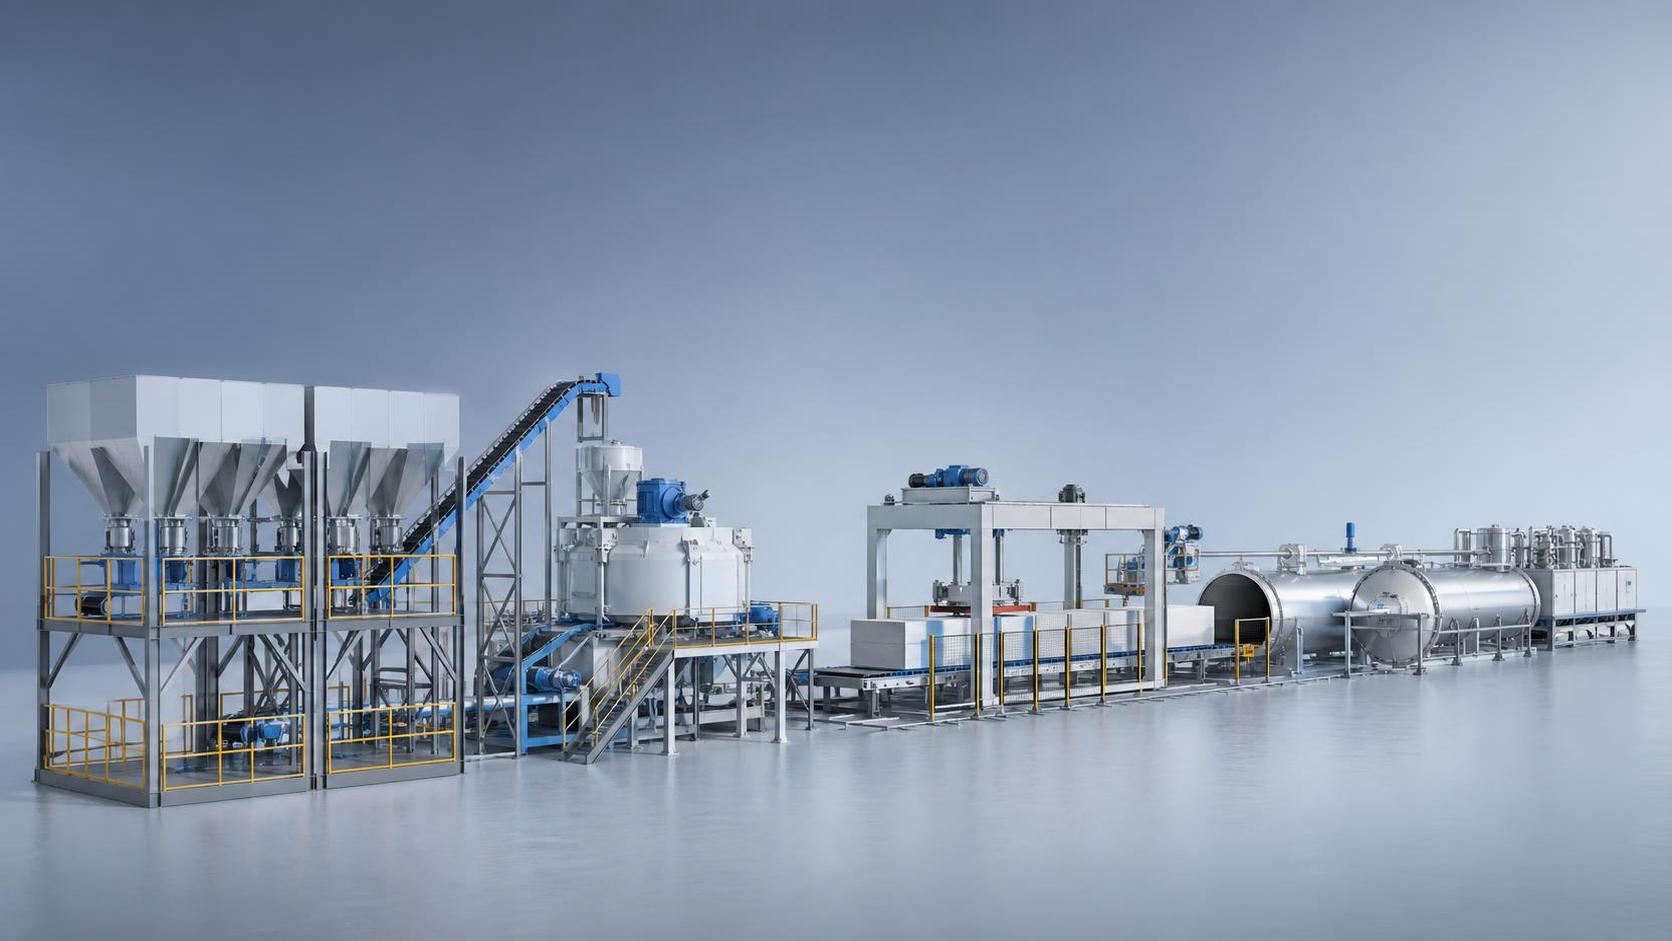
A full AAC project normally includes:
- raw material handling and dosing systems;
- ball mill, slurry preparation, and mixing equipment;
- casting, pre-curing, cutting, and grouping systems;
- autoclaves and steam distribution systems;
- finished product handling and packaging;
- boiler or steam source integration;
- electrical control, automation, and software systems;
- workshop steel structure and civil foundations;
- laboratory and quality control equipment;
- installation, commissioning, and operator training.
Some projects also require power upgrades, water treatment, environmental protection systems, compressed air stations, forklifts, and spare parts stock. If one proposal excludes these items, its investment cost per cubic meter will appear lower even though the total project outlay will not be.
The most important comparison: small, medium, and large AAC lines
The strongest influence on per-cubic-meter investment is capacity. Larger lines usually require more capital in absolute terms, but the unit investment often declines because fixed infrastructure is spread over more output.
As a general industry pattern, not a universal rule, AAC lines can be viewed in three broad groups:
- Small lines: suited to regional demand or first-time entry;
- Medium lines: the most common range for balanced capital efficiency and market flexibility;
- Large lines: typically favored where demand is stable, logistics are strong, and the investor can support higher upfront spending.
Small-capacity lines often look attractive because the total project budget is easier to finance. The problem is that autoclaving, steam systems, plant buildings, and utilities do not scale down proportionally. As a result, the investment cost per cubic meter is usually higher than in medium-size projects. This is one reason many smaller AAC plants struggle if they enter highly competitive markets on commodity products alone.
Medium lines are often the most defensible option for investors who need a workable balance between initial capital, labor organization, and market coverage. They usually offer better room for process automation and quality consistency without the financing pressure of a very large installation.
Large lines can produce the lowest unit investment under favorable conditions, but only if actual sales volume supports sustained utilization. A plant built for high annual output but operating far below capacity can become more expensive per cubic meter than a smaller, well-loaded line.
Automation level changes the economics more than many buyers expect
A second major comparison point is automation. Buyers often frame this as a simple choice between “manual” and “automatic,” but the real difference lies in how deeply automation controls dosing, cutting accuracy, autoclave scheduling, material transfer, and finished product handling.
Lower-automation lines usually reduce initial machinery expenditure. That can improve short-term affordability, especially in markets with low labor costs. But reduced automation may also create hidden costs:
- higher labor dependency;
- greater variation in density and compressive strength;
- more breakage during transfer;
- higher reject rates;
- longer startup and changeover times;
- weaker data visibility for process optimization.
Higher-automation lines generally require more capital, but they often lower the real cost per cubic meter by improving yield, reducing waste, and stabilizing quality. This is particularly relevant in export-oriented or specification-driven markets, where product consistency matters as much as nominal capacity.
For procurement teams, the practical decision is not whether the most advanced system is always better. It is whether the plant’s labor environment, technical team, and target product strategy can actually convert automation into measurable return.
Raw materials can make the same equipment look cheap or expensive
Many investors focus heavily on machinery pricing and not enough on raw material adaptability. In AAC production, lime, cement, gypsum, aluminum paste or powder, sand or fly ash, and water quality all affect equipment design and operating stability.
A line configured for one raw material route may require additional preparation systems for another. For example:
- sand-based AAC generally needs grinding and slurry preparation with specific energy and wear implications;
- fly ash-based AAC may reduce some raw material cost pressures, but quality variability can introduce process control challenges;
- local lime reactivity and gypsum quality can significantly affect consistency and curing behavior.
This matters because “investment cost per cubic meter” is not just a machinery number. If local raw materials are unstable, the buyer may need stronger dosing control, better storage, more laboratory capability, or more robust process design. That raises upfront spending but may be necessary to achieve saleable output.
In other words, a line that appears expensive may simply be properly engineered for the actual raw material conditions.
Energy systems are a decisive part of the calculation
Steam is central to AAC economics. The autoclaving stage directly influences both operating cost and plant layout, and the related systems can meaningfully change total capital investment.
Projects should compare at least these questions:
- Will the plant use a dedicated boiler or connect to an existing steam source?
- What fuel is locally available and commercially stable?
- How efficient is steam distribution and condensate recovery?
- Is the autoclave sizing aligned with actual production rhythm?
Where fuel prices are volatile or environmental requirements are tightening, energy efficiency often matters more than the lowest initial line price. Investors who underbudget steam systems may later face higher production cost per cubic meter, making the original capital saving irrelevant.
In regions with stricter emissions controls, auxiliary investment for boiler compliance or cleaner fuel adaptation may also be required. Applicable local rules should always be checked during feasibility review, as environmental permitting standards vary by country and jurisdiction.
The difference between theoretical output and saleable output
One of the most common errors in AAC project comparison is using theoretical line capacity as the denominator in every investment calculation. This inflates expected economics.
The more realistic measure is saleable output after considering:
- commissioning ramp-up time;
- maintenance downtime;
- breakage and cutting losses;
- quality rejections;
- seasonal demand fluctuation;
- market acceptance during the first operating cycle.
A plant designed for a large annual volume may not reach stable utilization immediately. If the first one to three years run significantly below design capacity, the effective investment cost per cubic meter will be much higher than the original feasibility model suggested.
For financial decision-makers, this is a key distinction: a lower nominal capex line can still underperform if output quality or utilization remains weak.
Regional factors often matter more than catalog pricing
For cross-border buyers and international project developers, regional conditions can distort comparisons if they are ignored. The same AAC line can have very different investment economics depending on where it is installed.
Important variables include:
- freight cost for oversized equipment;
- import duty, VAT, and customs procedures;
- local steel and cement prices for civil works;
- availability of skilled installers and maintenance personnel;
- grid stability and industrial power tariffs;
- distance from raw material source to plant;
- distance from plant to key construction markets.
This is why experienced buyers compare not just supplier quotations, but full delivered project cost. A lower FOB machinery price may lose its advantage once shipping, site modification, and local installation complexity are included.
How to judge whether a quoted cost per cubic meter is credible
Buyers should be cautious when a supplier offers an unusually low AAC project figure without detailed process definition. A credible estimate usually has clear assumptions behind it.
Useful questions include:
- What annual capacity basis is being used?
- Is the figure based on designed output or saleable output?
- Are autoclaves, boiler systems, and control systems included?
- What civil works assumptions are built into the estimate?
- What density range and product size mix is assumed?
- What raw material route is the plant designed for?
- What labor model and automation scope are assumed?
- What level of spare parts and after-sales support is included?
If the supplier cannot answer these points clearly, the benchmark may be too superficial for serious investment planning.
What type of investor should prioritize low initial capex, and who should not
Not every project should pursue the lowest possible investment cost per cubic meter. The right choice depends on business model.
Cost-sensitive market entry projects may accept a simpler configuration if local demand is still being tested and labor is affordable. In that scenario, preserving cash and reducing financing pressure can be rational.
Quality-driven producers supplying engineered construction systems, large developers, or projects with demanding performance specifications typically benefit from stronger automation, better control systems, and more robust quality assurance. Their target is not the lowest line price, but predictable product performance and lower reject rates.
Long-horizon industrial investors usually do better with a lifecycle view. Over ten years, yield stability, energy efficiency, spare parts availability, and technical support can matter more than the initial difference in capital per cubic meter.
A more useful way to compare AAC line investment
Instead of asking for a single industry-wide number, buyers should compare projects using a structured framework:
- Capital efficiency: total installed investment versus realistic annual saleable output;
- Process fit: suitability for local raw materials and target product mix;
- Operating resilience: expected energy use, maintenance burden, and yield stability;
- Execution risk: delivery reliability, commissioning support, and local service capability;
- Expansion logic: whether the line allows future capacity growth or product upgrades.
This approach gives a far more decision-useful result than comparing equipment catalog prices alone.
Where the real investment decision usually lands
In most AAC projects, the most economical choice is not the smallest line, the cheapest quote, or the highest level of automation available. It is the configuration that matches local raw materials, achievable sales volume, utility conditions, and management capability.
That is why the investment cost per cubic meter should be treated as a comparative decision metric, not a universal benchmark. A good figure is one that remains defensible after commissioning, under real operating conditions, with saleable output and acceptable energy consumption.
For buyers evaluating an aerated concrete block production line, the better question is not “What does one cubic meter of capacity cost?” but “What kind of plant can produce one saleable cubic meter reliably, competitively, and at the quality level the market will continue to buy?”
That distinction is where sound AAC investment decisions are usually made.
Recommend
 Sep 23, 2026
How automatic AAC production line stability affects block quality
Automatic AAC production line stability directly shapes block strength, density, and dimensions. Learn how tighter process control reduces defects, waste, and safety risks.
- Sep 23, 2026
What to check before buying autoclaved aerated concrete equipment
Autoclaved aerated concrete equipment buying guide: learn what to check on line balance, raw materials, energy use, maintenance, and support before choosing a reliable AAC solution.
- Sep 24, 2026
How to reduce downtime caused by worn AAC plant machinery
AAC plant machinery downtime can be cut by spotting wear early, prioritizing critical parts, and using smarter maintenance strategies to keep production stable and costs under control.