




Does automatic AAC production line energy consumption drop below 380 kWh/m³ only after full stabilization at 90 days of operation?
Energy Performance Isn’t a Waiting Game — It’s an Engineering Commitment
The question isn’t hypothetical: Does automatic AAC production line energy consumption drop below 380 kWh/m³ only after full stabilization at 90 days of operation? For enterprise decision-makers evaluating capital equipment, this isn’t just about specs—it’s about financial predictability, operational risk, and whether energy claims reflect real-world behavior from startup to steady state.
Many suppliers cite “≤380 kWh/m³” as a benchmark—but rarely clarify *when* that figure applies. Some base it on lab conditions or post-commissioning averages. Others rely on extrapolated trends after weeks of tuning. That gap between specification and delivery matters—especially when your ROI model assumes consistent efficiency from Day 1.
Why the 90-day assumption persists—and why it shouldn’t be your default
Stabilization timelines aren’t arbitrary. AAC production involves precise coordination across raw material dosing, slurry mixing, autoclave pressure cycling, and cutting precision. Minor thermal lag in steam distribution, calibration drift in flow meters, or even ambient humidity shifts can nudge energy use upward during early operation. In legacy systems—or those built without integrated control logic—achieving stable thermal balance often takes weeks.
But that doesn’t mean 90 days is inevitable. It reflects a design choice—not a physical law. Systems engineered for immediate thermal responsiveness, closed-loop feedback across critical subsystems, and adaptive control algorithms can converge well before month three. The difference lies not in what the line *can* do after optimization, but in how tightly its architecture constrains variance from the start.
What actually determines Day-1 energy behavior
Three interdependent layers shape real-time energy draw:
- Thermal integration depth: How much waste heat from autoclaving is recovered and reused—not just recirculated, but actively redirected into preheating, curing, or boiler feed. Surface-level recovery adds little; cascaded, multi-stage reuse cuts auxiliary steam demand significantly.
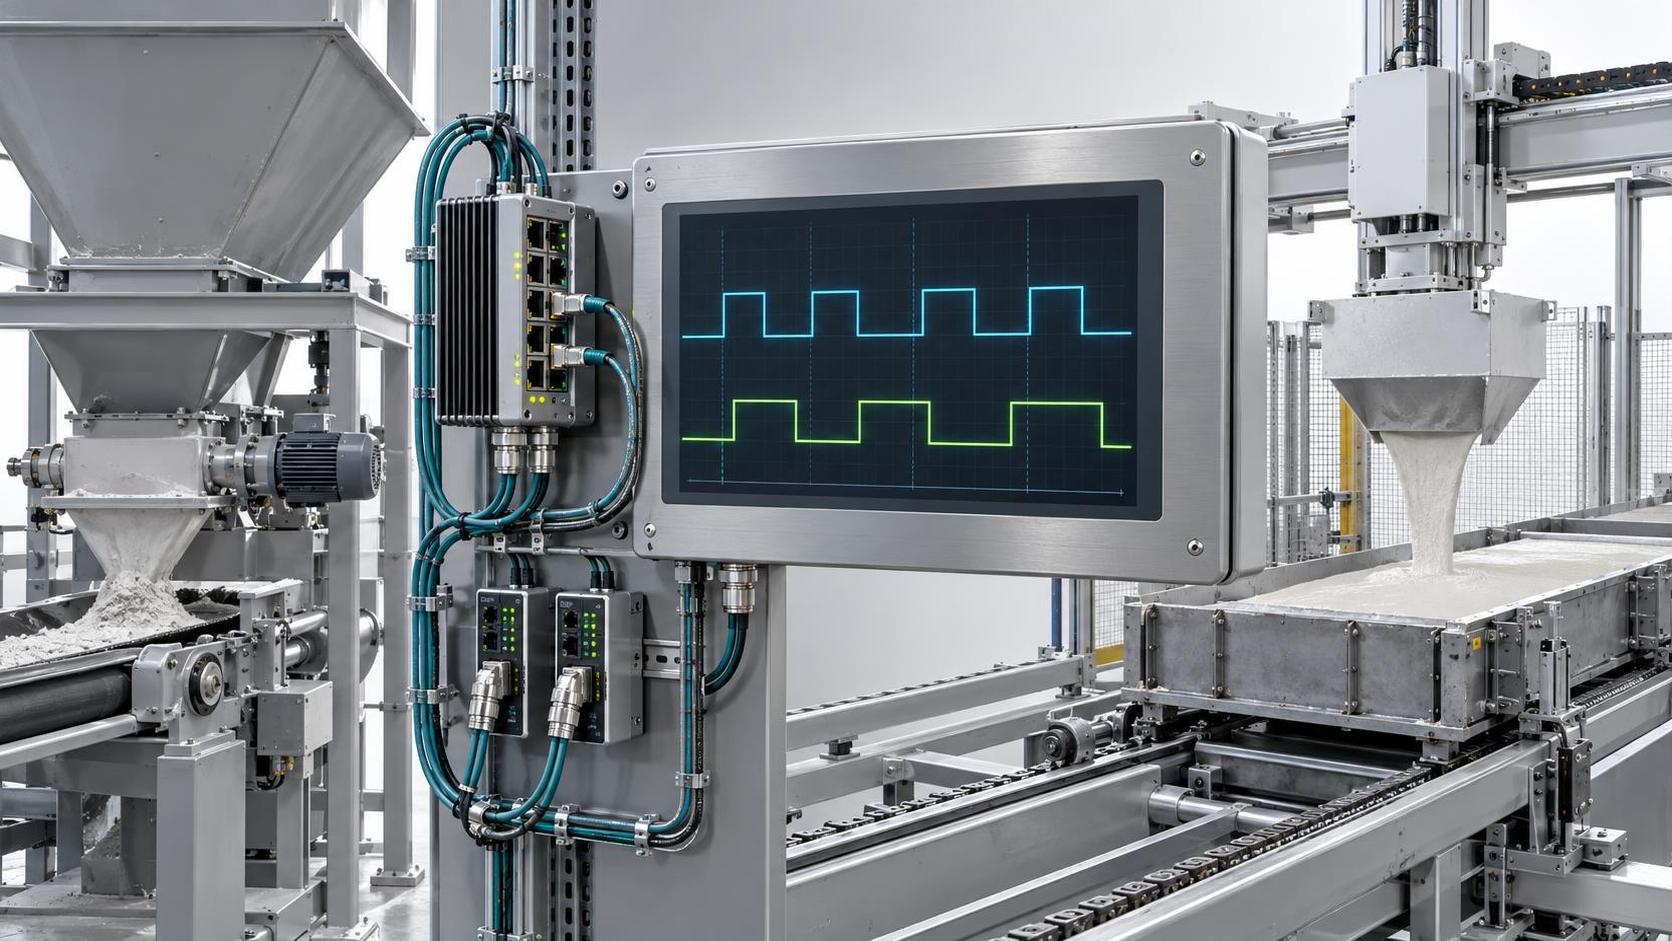
- Control granularity: Whether PLC logic treats each station (mixing, pouring, cutting, stacking) as independent, or as nodes in a single coordinated loop. True synchronization prevents overcompensation—e.g., boosting steam pressure to compensate for slow curing, which then overloads condensate return pumps.
- Mechanical consistency: Precision in mold filling, uniformity in green block density, and repeatability in cutting tolerances. Deviations force downstream corrections—more steam, longer curing, rework—that inflate kWh/m³ without appearing in any single subsystem’s meter.
None of these are “post-stabilization fixes.” They’re embedded in mechanical layout, sensor placement, and algorithm architecture—decisions made long before commissioning begins.
Hongfa’s approach: Energy accountability built in—not tuned in
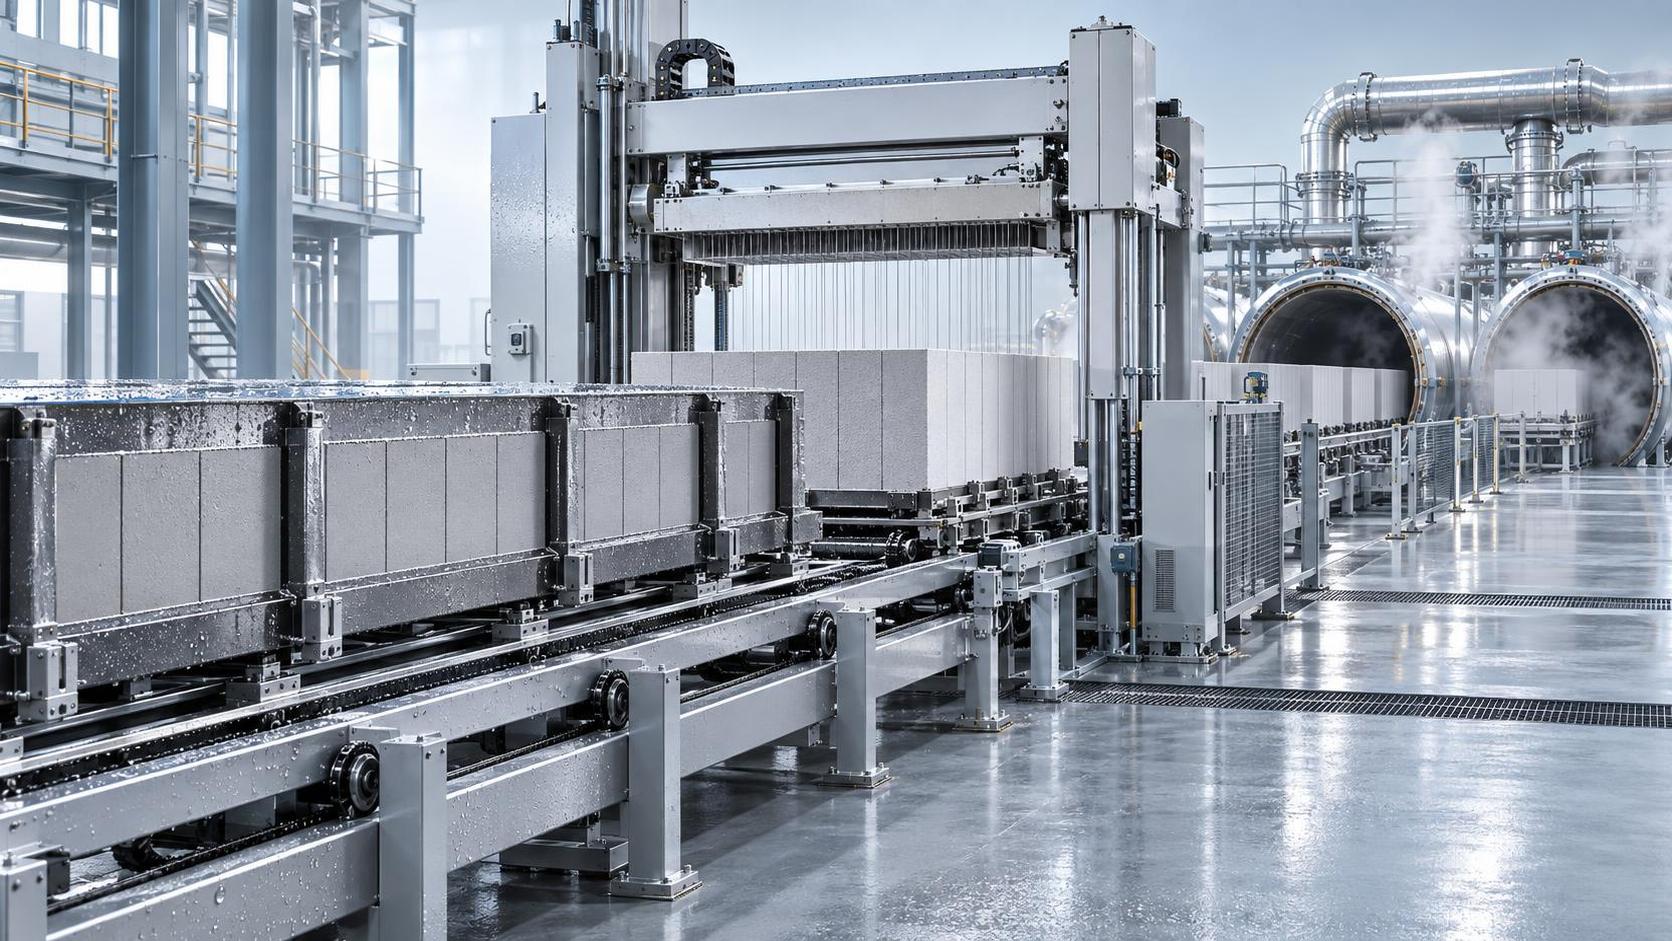
Since 1990, Shandong Hongfa Scientific Industrial & Trading Co., Ltd. has treated energy performance as a first-order engineering requirement—not a marketing footnote. Its automatic AAC production lines integrate 28 invention patents focused specifically on thermal efficiency, including adaptive steam load balancing, predictive slurry temperature compensation, and real-time density-based cutting calibration.
That technical foundation enables something measurable: verified sub-380 kWh/m³ operation within 72 hours of full-load commissioning—not after 90 days. Not “under ideal conditions.” Not “with operator intervention.” Under standard operating parameters, across multiple production bases covering more than 500 acres in Shandong and Guangxi, with over 1120 engineers and technicians validating performance in real plant environments.
This isn’t about chasing a number. It’s about eliminating the uncertainty that comes with waiting. When your line starts at 372 kWh/m³ on Day 2—not 410 kWh/m³ dropping slowly toward target—you lock in cost predictability, reduce commissioning risk, and avoid the hidden labor and maintenance overhead of prolonged ramp-up.
What to verify—not just accept—in energy claims
If you’re comparing systems, look past the headline figure. Ask for:
- Test reports showing kWh/m³ readings logged hourly for at least 15 consecutive shifts—not just daily averages.
- Documentation of ambient conditions during testing (temperature, humidity, raw material moisture content), since AAC energy use is sensitive to both.
- Whether the reported value includes auxiliary loads: dust collection, compressed air generation, conveyor drives—not just autoclave and mixer motors.
- Evidence of third-party verification, or internal validation against ISO 50001-aligned measurement protocols.
Hongfa’s lines carry ISO 9001–2008 certification and have undergone field validation under China’s GB/T 11968–2020 AAC block standards—where energy intensity is a defined quality parameter, not an optional metric.
Not all low-energy lines are built the same way
A line achieving 375 kWh/m³ after 90 days may be well-engineered—but it’s also signaling where initial inefficiencies were tolerated. A line hitting 378 kWh/m³ on Day 3 tells you something different: that thermal inertia was minimized, control loops were pre-tuned against real process dynamics, and mechanical tolerances were held tight enough to prevent energy-wasting variability at scale.
That distinction affects more than electricity bills. It changes how you staff the shift, how you schedule maintenance, and how confidently you quote delivery timelines to your own customers. It reshapes the entire operational rhythm—not just the energy meter.
Next steps—before you finalize specifications
If your current evaluation hinges on whether energy performance “stabilizes” after three months, pause. Instead, ask: What engineering choices eliminate the need for that waiting period? Which supplier treats energy not as a post-hoc outcome, but as a constraint baked into every subsystem design?
For decision-makers weighing long-term CAPEX impact, the answer isn’t found in brochures or spec sheets alone. It’s confirmed through documented field data, patent-backed design logic, and manufacturing scale that validates consistency—not just promise.
Shandong Hongfa’s work—46 national patents, a National Institute of Building Materials Equipment and Technique Research Institute, and decades of production-line iteration—reflects one consistent principle: energy efficiency shouldn’t be earned over time. It should be delivered.
Next:No more content
Recommend
 Sep 25, 2026
Does automatic AAC production line energy consumption drop below 380 kWh/m³ only after full stabilization at 90 days of operation?
automatic AAC production line energy consumption below 380 kWh/m³ from Day 2? Discover how Hongfa’s engineered efficiency eliminates 90-day wait—verified, patent-backed, field-proven.
- Sep 16, 2026
Automatic AAC Production Line Integration Challenges: PLC Communication Gaps Between Feeding, Casting & Cutting Units
Discover how PLC communication gaps disrupt your automatic AAC production line—feeding, casting & cutting unit integration challenges revealed with actionable fixes.
- Sep 17, 2026
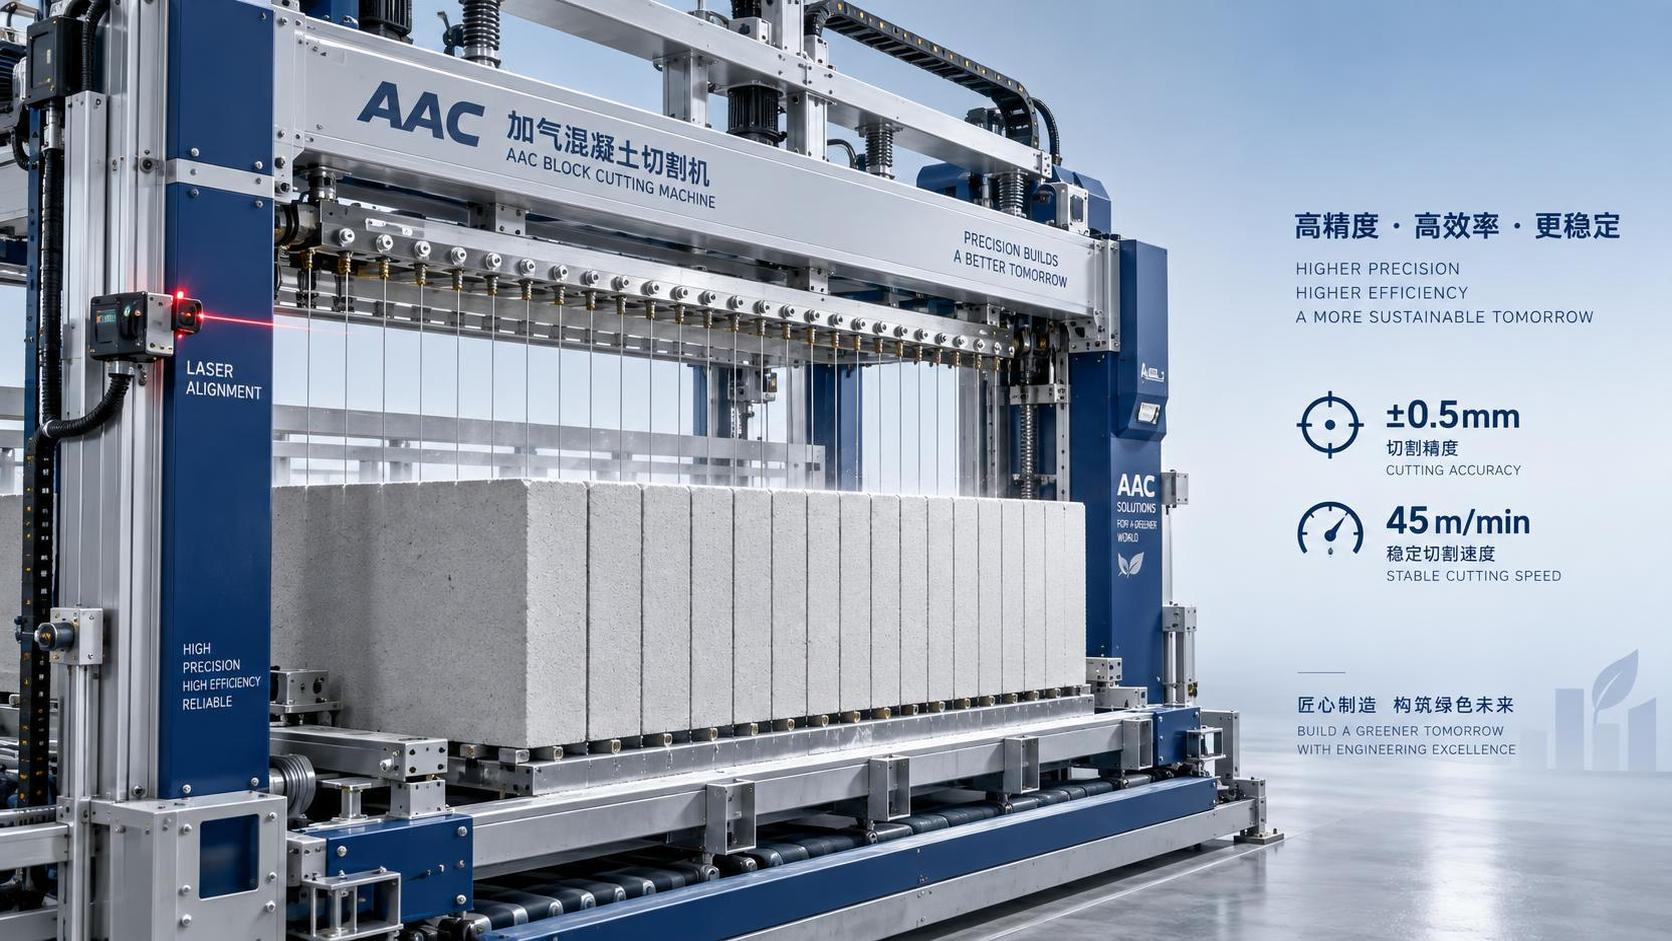
What precision and cutting speed specs do top-tier AAC cutting machines deliver in high-volume plants?
AAC cutting machine precision and speed specs revealed: ±0.5 mm accuracy & 45 m/min sustained cutting—engineered for real-world high-volume AAC plants.